
Infographics are a mix of words and images to provide further information about a topic. Infographics can be used as graphical abstracts to describe research papers. Infographics can be picture heavy, with text adding extra information. Conversely, infographics may have a lot of text with some images to help explain the point.
Below are samples of some of my work. However, further pieces can be shared upon request. Jump to:
“It’s a true pleasure to work with someone who not only has a deep appreciation for science, but also a genuine passion for translating complex information into insights that help others improve their lives. I greatly admire Shira’s ability to interpret nuanced concepts with clarity and purpose, while remaining thoughtful and inclusive in every discussion. Her sense of humor and positive attitude are contagious, and she has a remarkable way of engaging everyone in the room, making each person feel seen and valued. She brings intellectual rigor, warmth, and collaboration to every team she’s part of—and is truly a gem to work with.“
-Abigail Garza, Senior Creative, Designography
Simple Infographics
Simple infographics usually portray a single concept or small related ideas. The often contain largely images and a small amount of text.
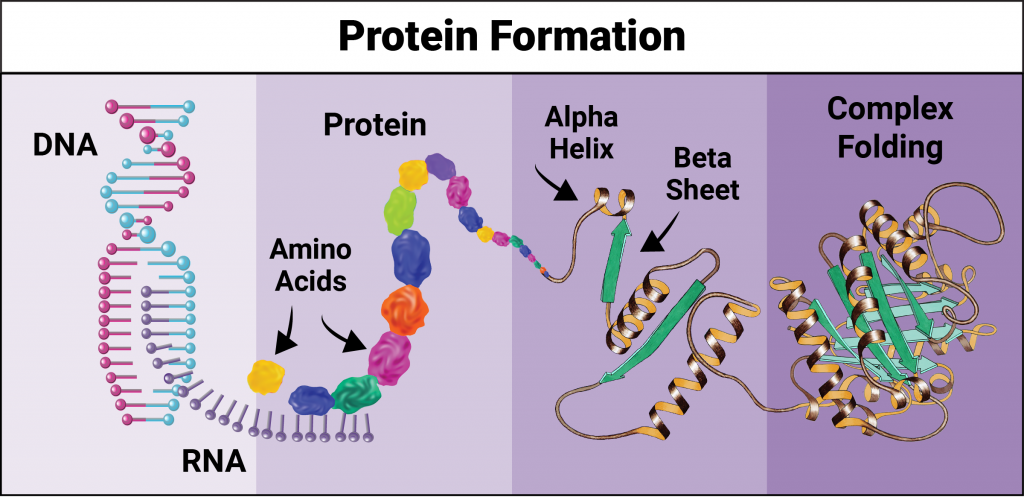
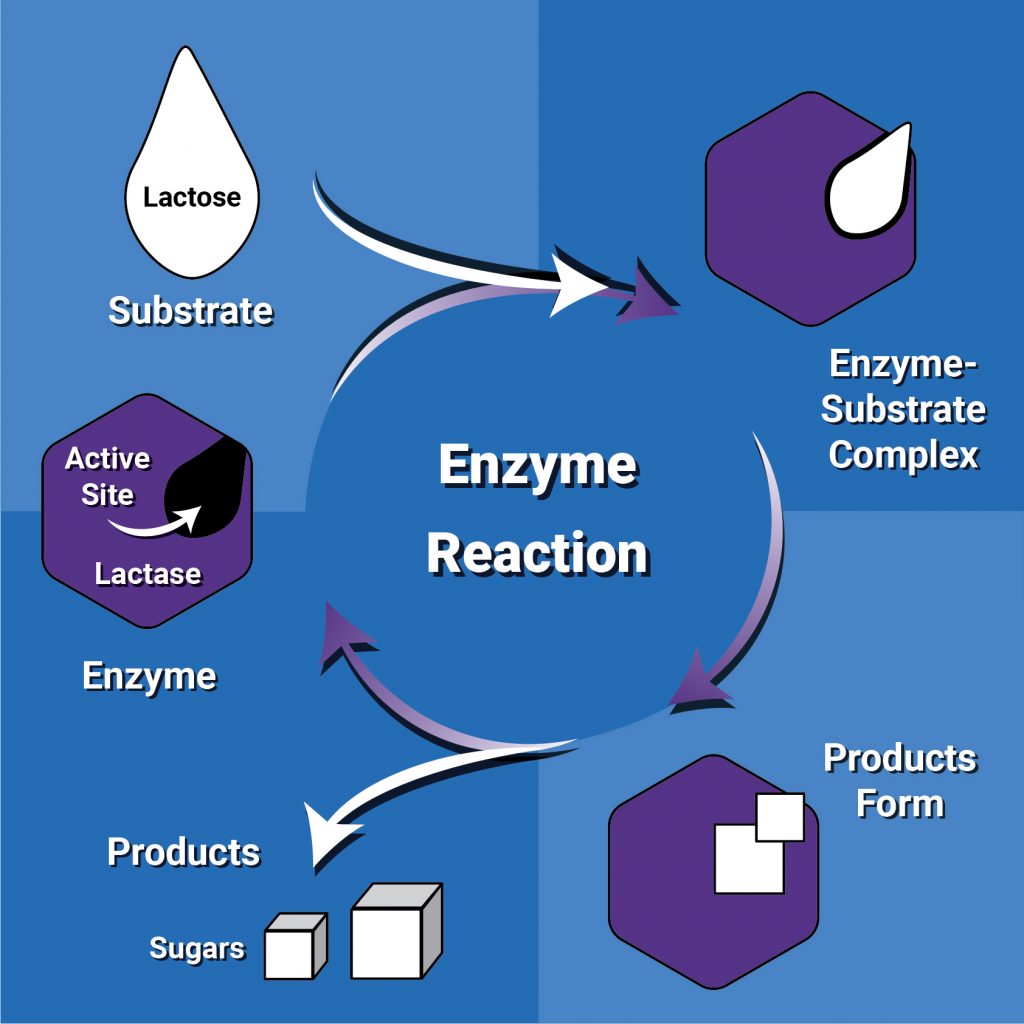
The first two graphics are for more advanced audiences. The images assume the reader has a basic understanding of words like DNA, protein, and amino acids. Additional text in a figure legend or lecture is helpful to more fully understand the content.
The third graphic is for a more general audience. It shares basic information about plastics in the environment. This graphic does not need a figure caption to help explain the message.
How Do Proteins Form?
DNA codes RNA, which in turn codes amino acids. The amino acids then fold together and help determine the protein’s primary structure. Typical shapes include alpha helices and beta sheets. Then the protein folds in on itself to create the 3D tertiary structure.
How Do Enzyme Reactions Work?
Why Are Ocean Plastics a Problem?
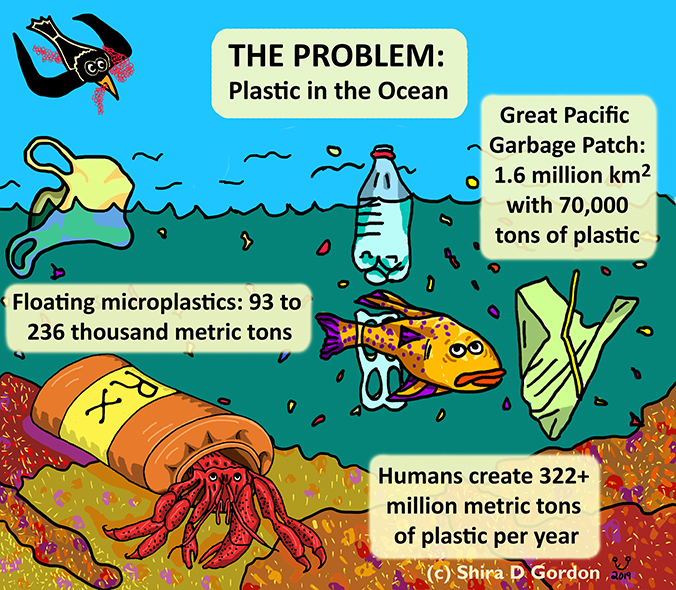
This infographic highlights some key facts about plastics and the problems. Watch a related video Clean Air Clean Water that explains why the animals care, without going into the details.
Detailed Infographics
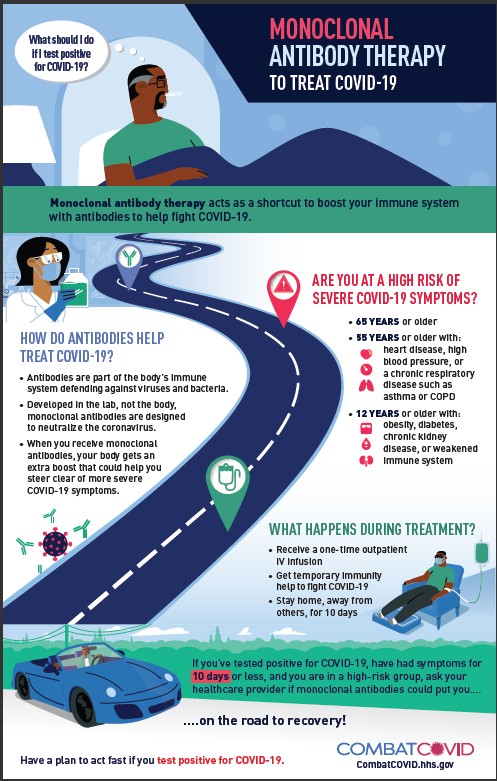
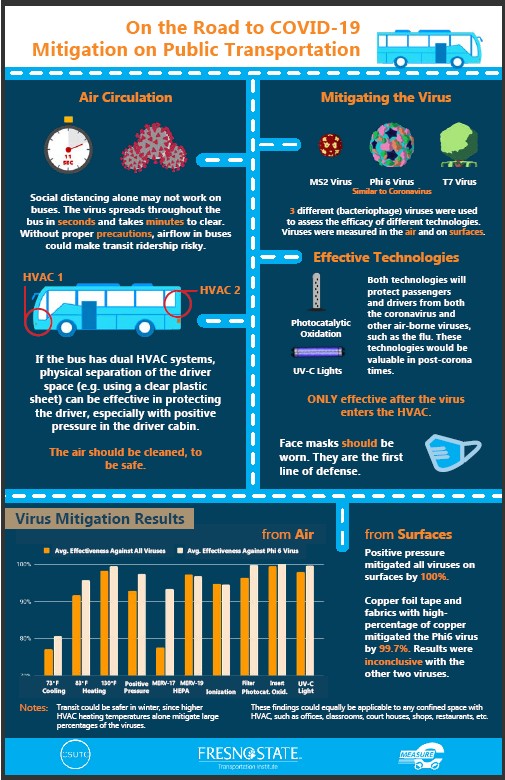
Detailed infographics contain more information and more text. They usually are explaining several related points about a topic. These infographics do not usually need a figure legend.
*Graphics drawn in collaboration with artists.
*Graphics drawn in collaboration with artists.
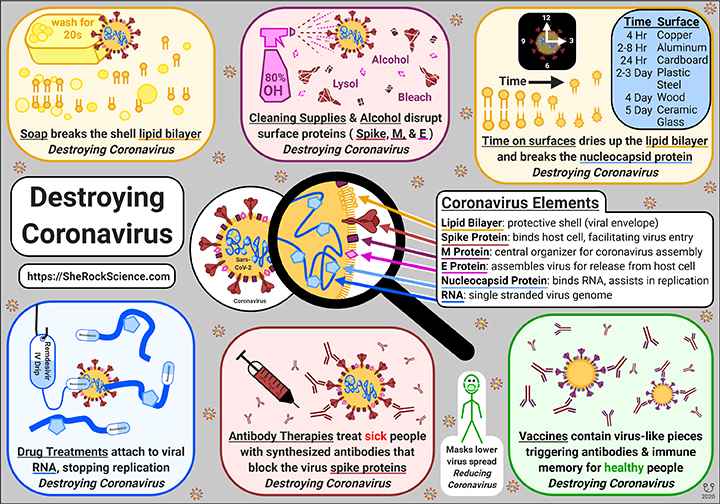
Destroying Coronavirus, published by Lifeology.
Fact Sheets
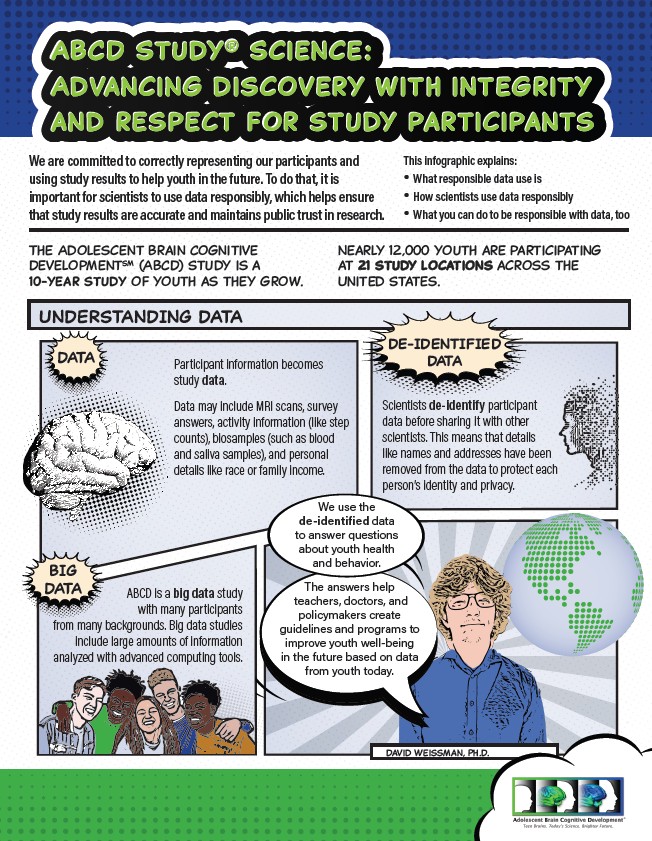
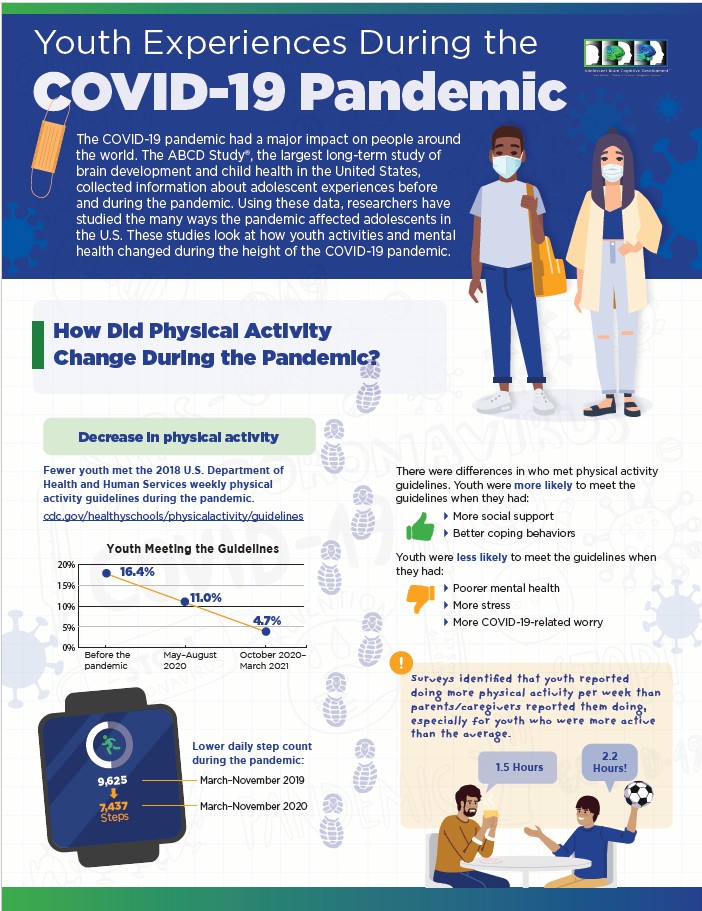
Fact Sheets often take the reader through a several page topic exploration. Here are two examples (first page only) from the Adolescent Brain Cognitive Development (ABCD) long-term study that Dr. Gordon wrote and worked with an illustrator to produce the final products.
Research Abstracts and Figures
Graphics can be used for figures within articles and books. In addition, graphics may be used to create a graphical abstract for a research article. Below are some samples from Dr. Gordon’s research about the glassy-winged sharpshooter.
Brief Summary: A pest insect, the glassy wing sharpshooter, lives on a grapevine. These insects use vibrations to talk with each other; using speakers to play the female song back disrupts mating.
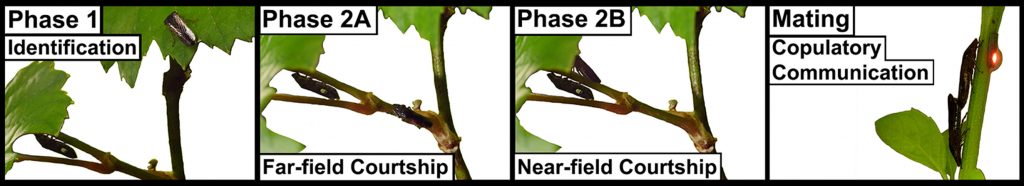
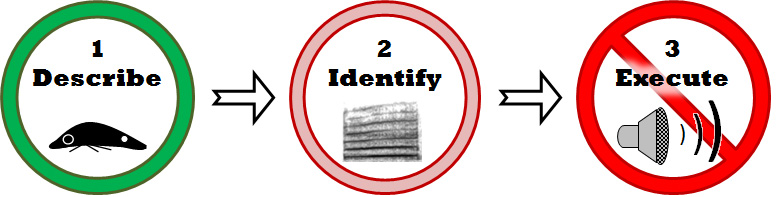
Glassy-Winged Sharpshooter Mating and Control
These two figures were published as part of a book chapter (Gordon and Krugner, 2020). More details are described in the text and during presentations.
Graphical Abstracts
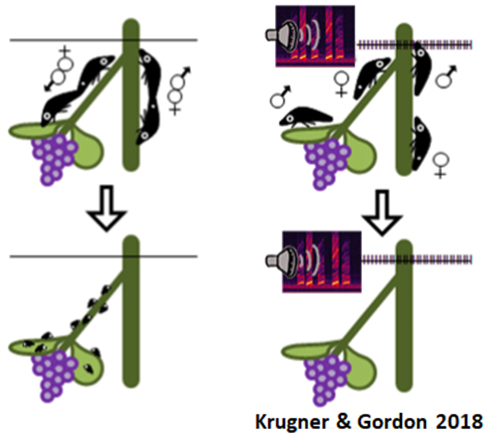
Gordon and Krugner, 2018
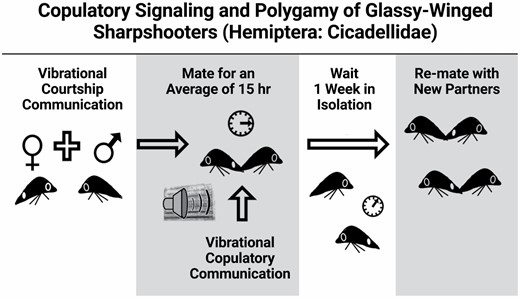
Gordon and Krugner, 2021
Cactus Communication Infographics
Dr. Gordon worked with Cactus Communication to help them create infographics for research articles. Her role was summarizing the primary literature, creating the text, and suggested images. For these projects different artists were used to create the final piece (2019, 38 infographics).
#SheRockScience #SheRockScienceProduction #SciComm #SciArt email: Shira at SheRockScience.com